Sometimes you map just for fun. The maps below were attempts to stretch my skills or just play around with new tools or techniques.

|
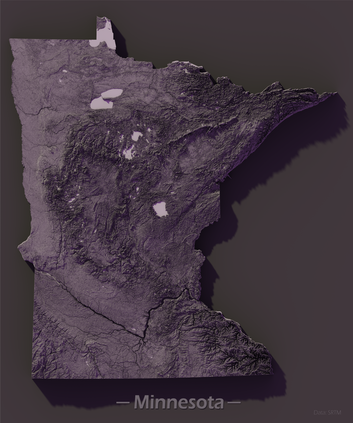
Relief map of Minnesota (2021). Made with Aerialod.
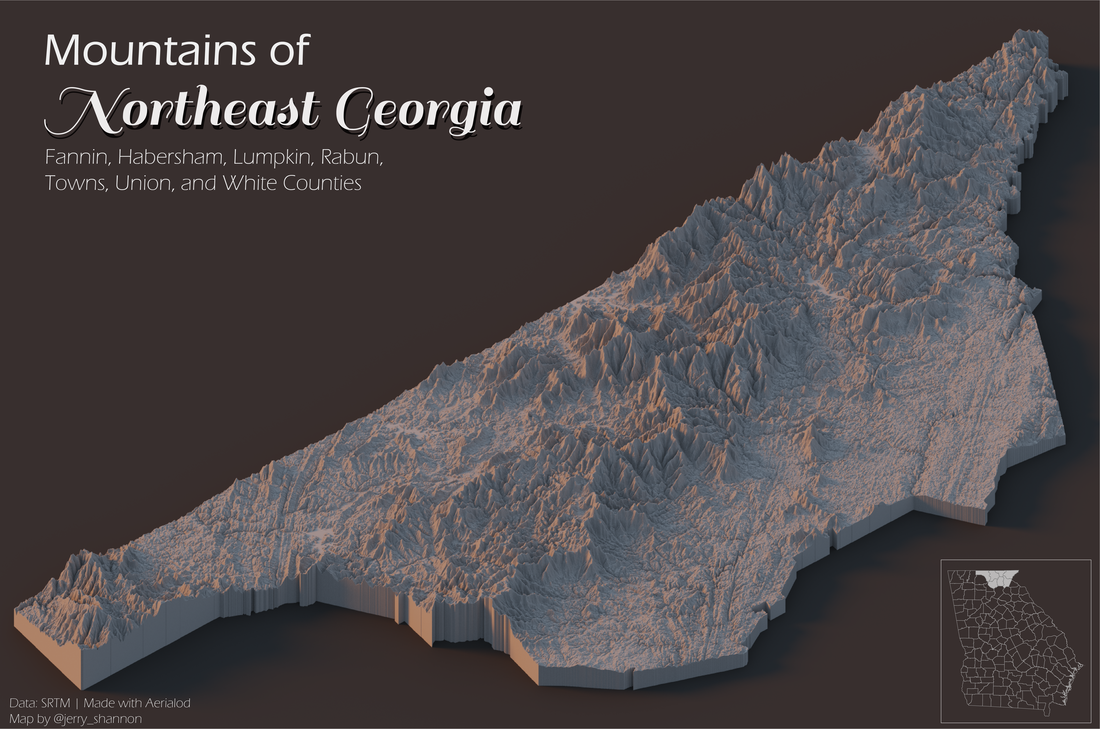
Map of the Northeast Georgia Mountains (2021). Made with Aerialod
Map of the Blue Ridge Mountains (2020). I used Blender to create hillshades for this map, which is combined with land cover from the NLCD and various data on state parks and Appalachian Trail related amenities. The initial map was created in QGIS in finished off in Adobe Illustrator.
|
|
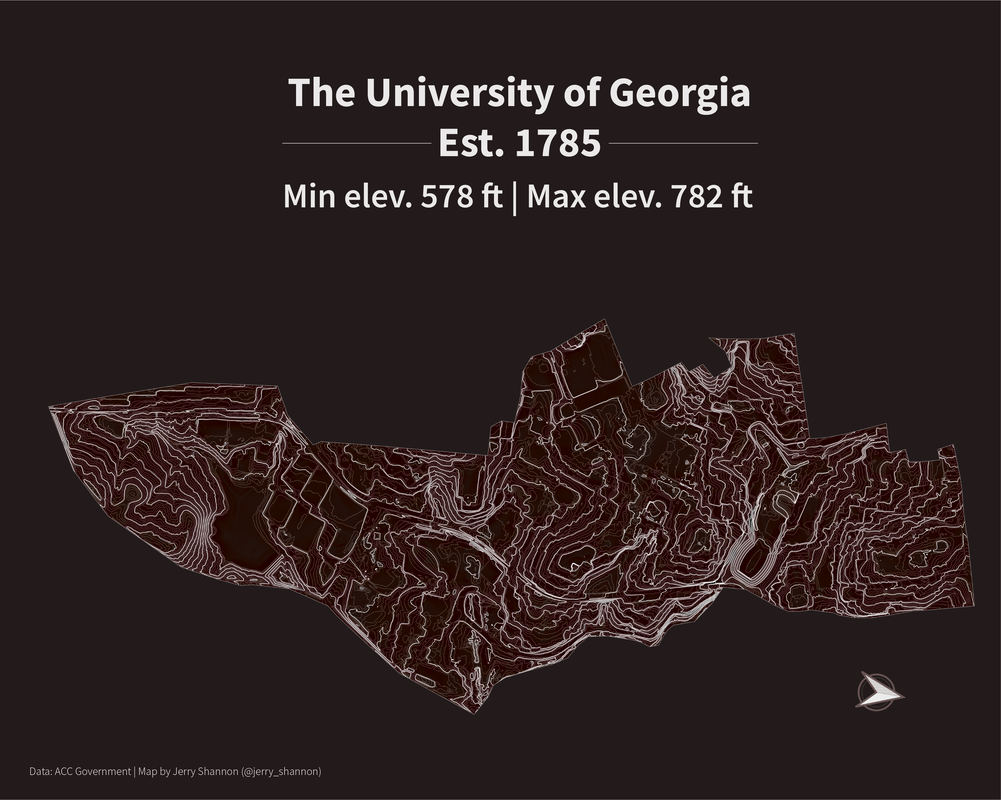
A campus contour map of UGA. Contours generated through R, cartography in QGIS. (2019-20)
|
|
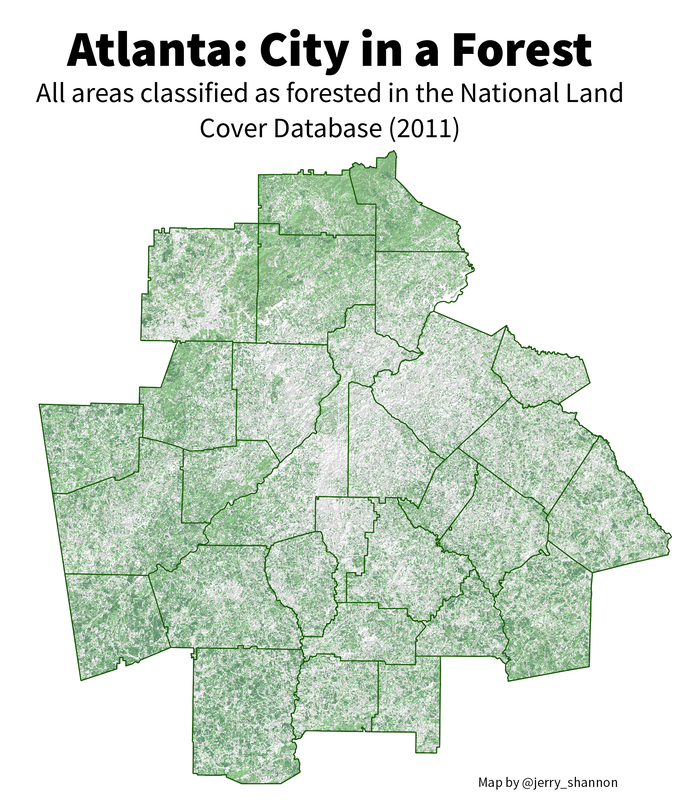
Areas of Atlanta classified as forested. I created this in 2019 based on NLCD data in QGIS.
|
|
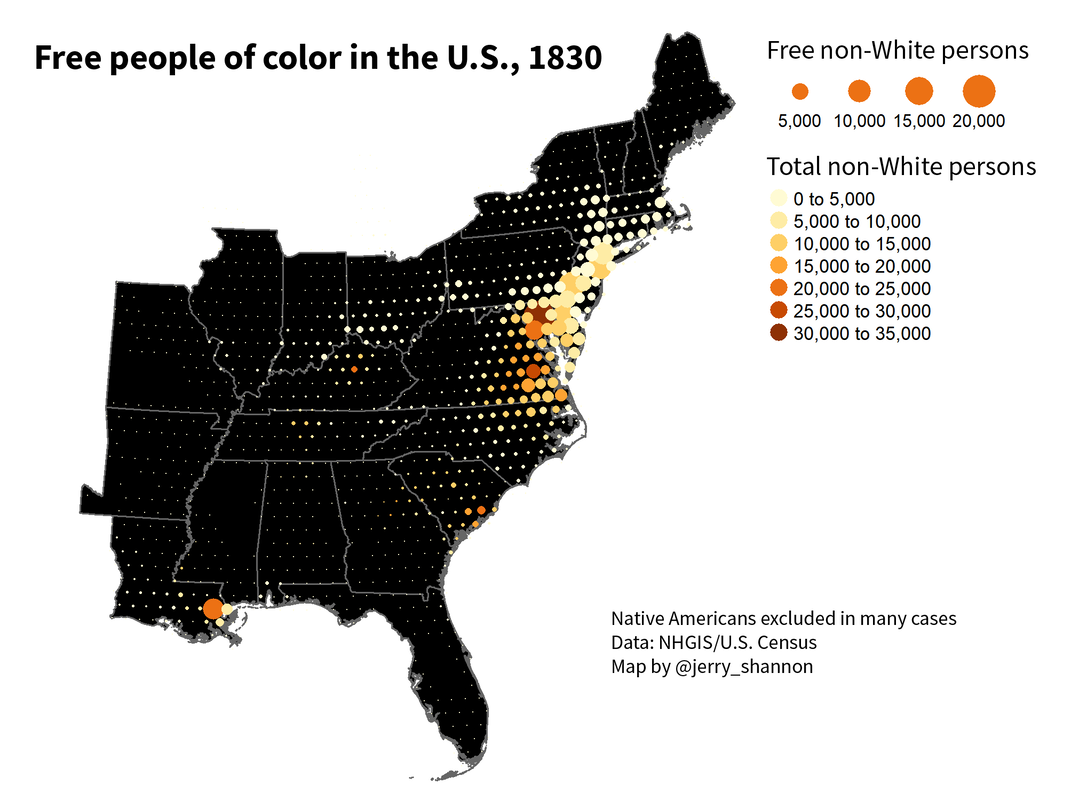
A map of "free people of color" based on data from the 1830 Census provided through NHGIS. Data analysis in R and map made in QGIS. (2019)
|
|
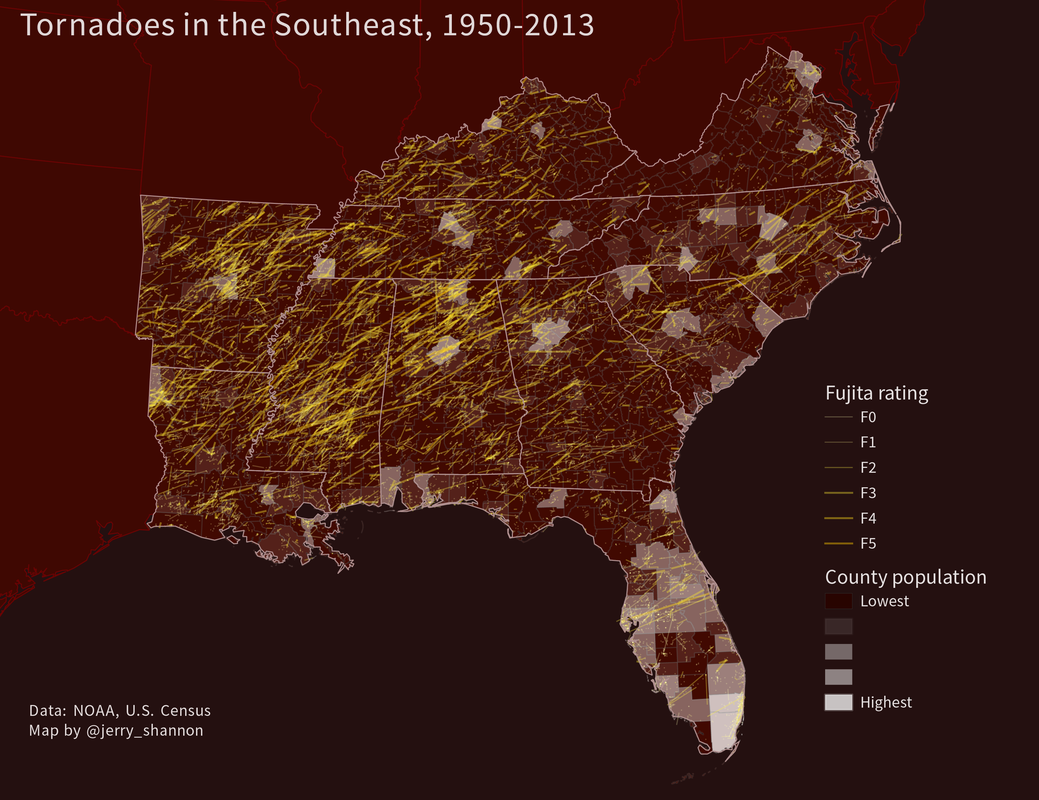
Data on tornadoes in the Southeast, provided by NOAA. I use this dataset in my Data Science in Geography class, but I made this map in QGIS as part of the 30 Days of Mapping challenge in November 2019.
|
